X-ray any GitHub repo
right in your browser
Paste a repository and get an interactive architecture map — dependency graph, blast radius, health grade, security scan and hotspots. Free, no signup.
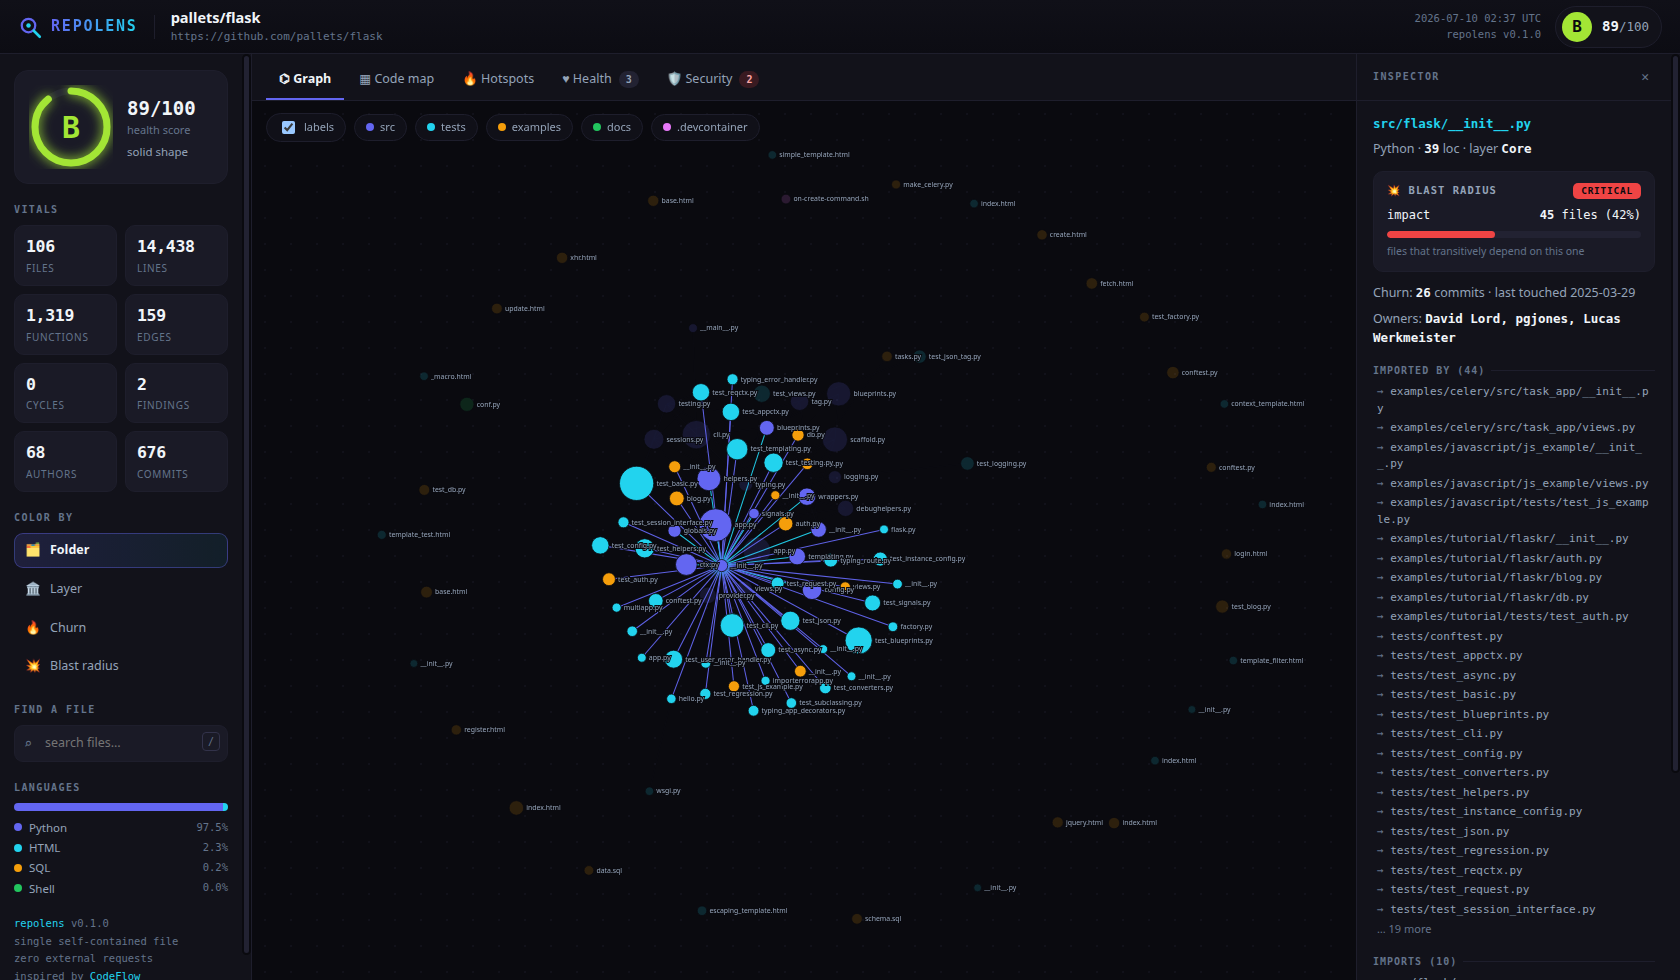
Interactive dependency graph
Force-directed map of every file. Color by folder, layer, churn or blast. Click any node for imports, dependents, functions and owners.
Blast radius
"If I change this file, what breaks?" — transitive-dependent analysis answers it per file, with a severity meter.
Health grade A–F
Cycles, coupling, oversized files and security findings — a transparent penalty breakdown, never a black-box number.
Security scan
Committed keys and tokens, SQL built by string-glue, eval/exec, disabled TLS verification. Test paths auto-demoted.
Hotspots & ownership
Per-file commit churn and top contributors mined from git history — know what's volatile and who to ask.
One self-contained file
Each report is a single HTML file with zero external requests — save it, email it, attach it to a PR.
Prefer the terminal? One line, no limits.
The hosted tier caps repo size and rate — the open-source CLI analyzes anything, locally, and your code never leaves your machine.
$ uvx repolens-kit owner/repo